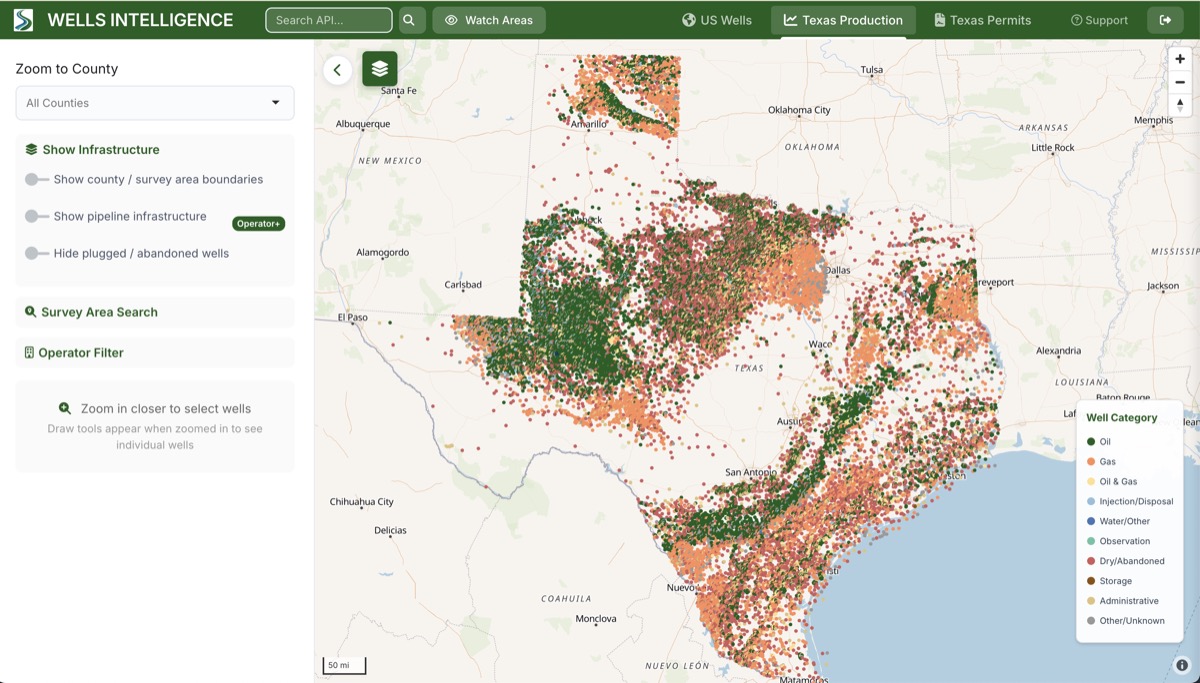
1.2 million Texas wells. 75.5 million production records. Updates in your inbox.
Browse the national wells map for free. Upgrade for full Texas production data, permits, and analytics.
Every Texas oil and gas well on a map with 30+ years of production history. Real-time drilling permit tracking so you see new activity as it gets filed with the RRC.
Decline curves, production forecasts, and operator benchmarking. Compare well performance across basins, operators, and time periods to find the patterns that matter.
Draw custom watch areas and get email alerts on new permits, completions, and production changes. AI-generated summaries tell you what happened and why it matters.
Evaluate acquisition targets with production history, offset well performance, and permit activity. Set watch areas to track new drilling in your focus counties.
Benchmark your wells against offsets, track competitor activity, and monitor your portfolio from a single dashboard. 
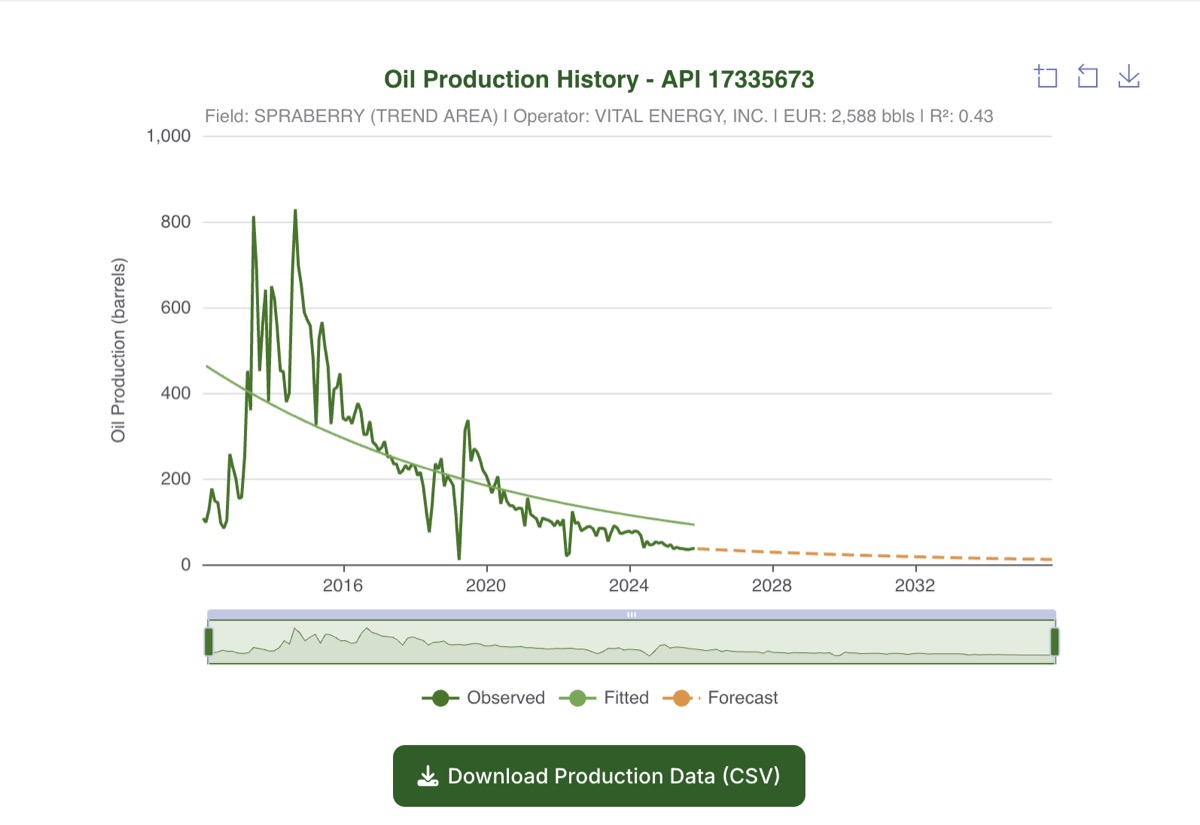
Decline curves and production forecasts
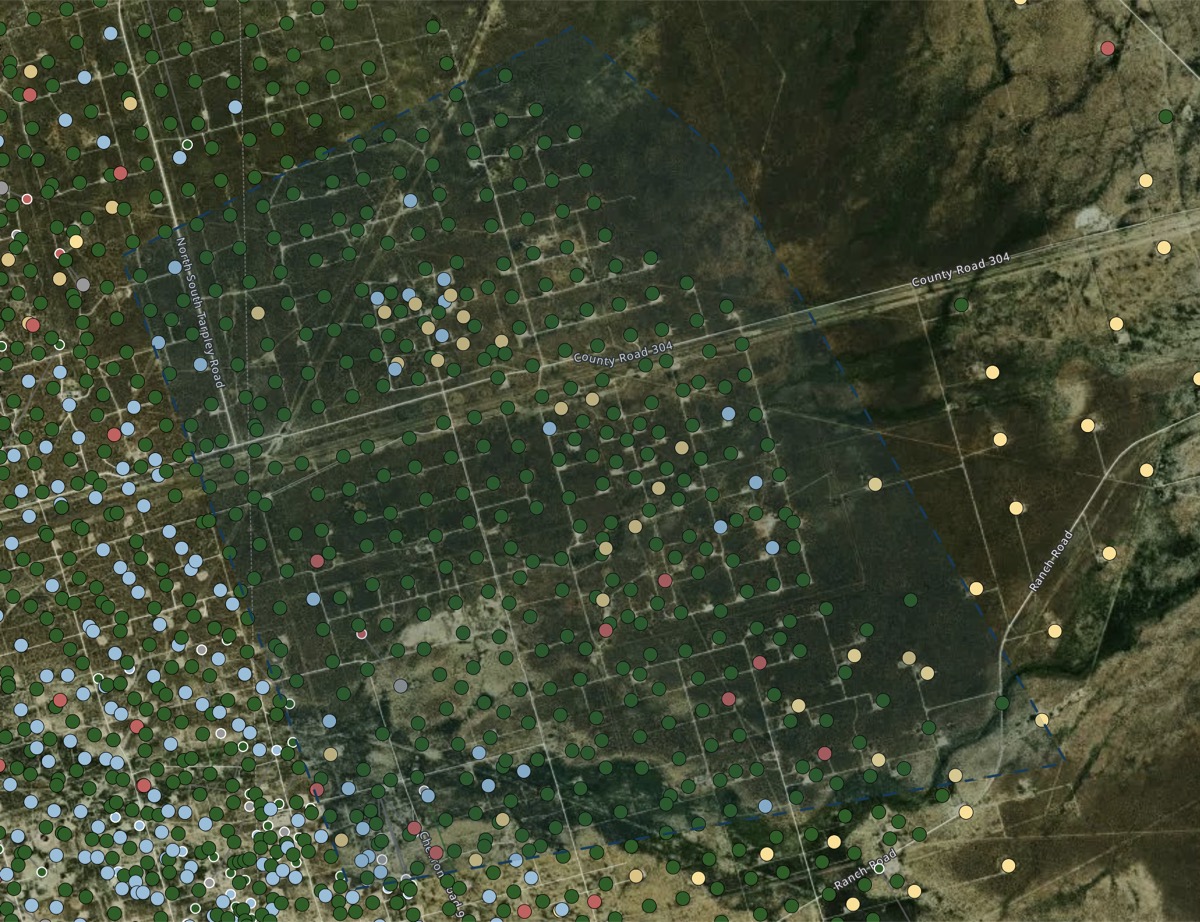
 for development planning.
Basin-level production trends, operator rankings, and permit activity all in one place. Export data for your own models and reports.
Understand drilling activity and production density around planned infrastructure. Monitor permit trends to anticipate demand for midstream, power, and services.
The national wells map is free to explore. Texas production data, permits, watch areas, and analytics are available with a paid plan.